Overview
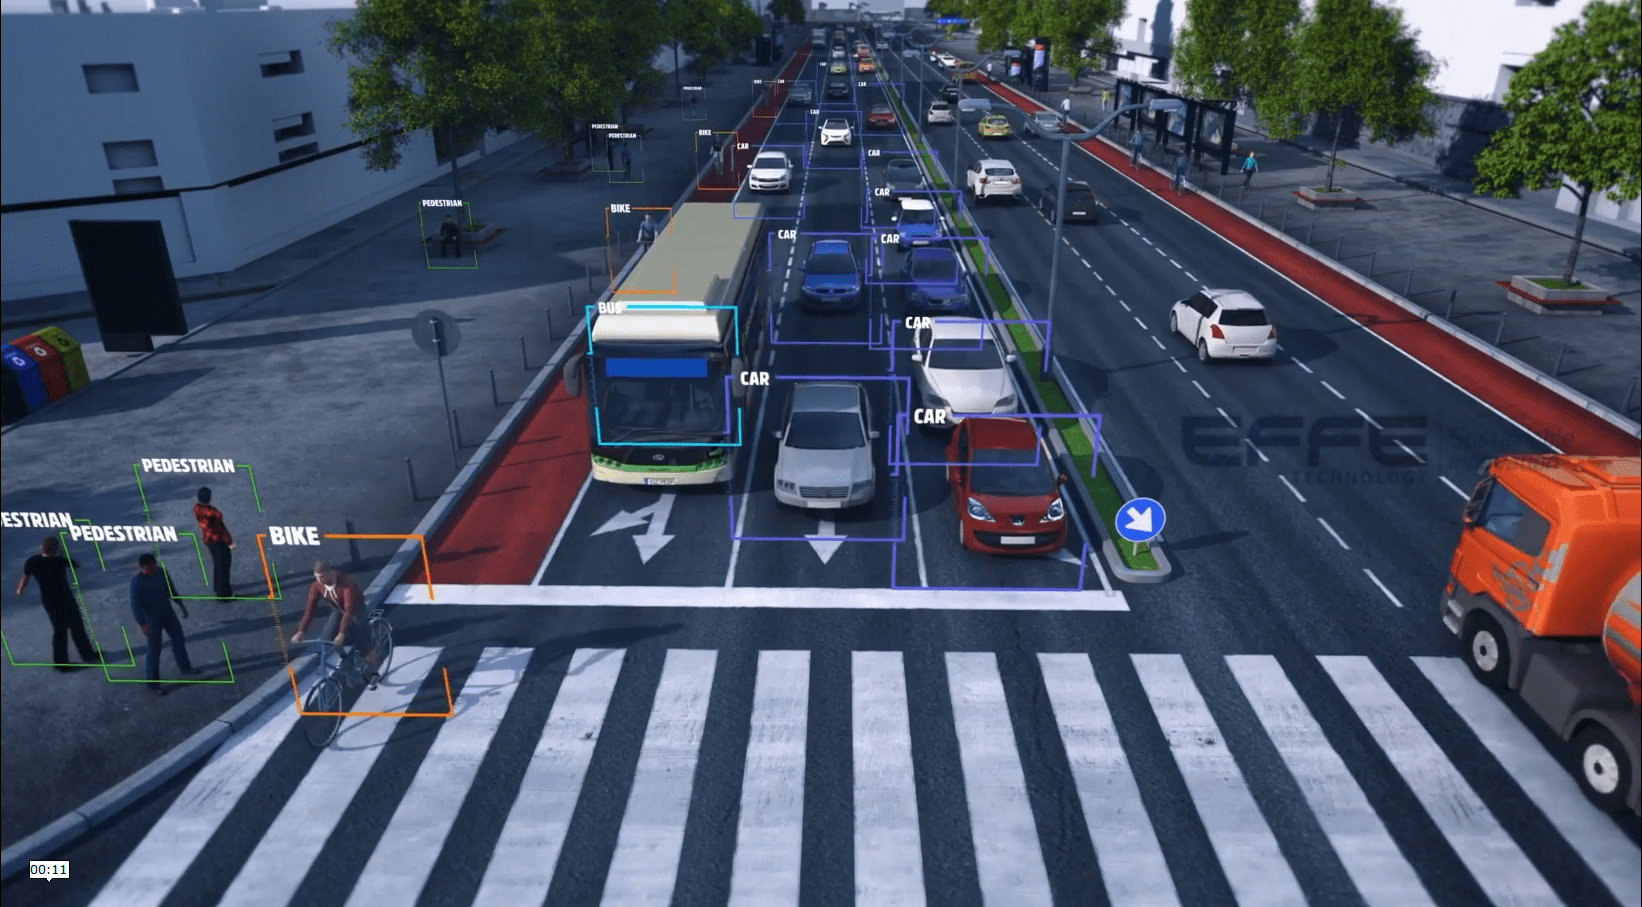
Rapid urbanization has made traffic congestion, road safety, and mobility management some of the biggest challenges for modern cities. Traditional traffic monitoring systems rely on 2D dashboards, CCTV feeds, and fragmented data platforms that make it difficult for authorities to gain a holistic understanding of real-time traffic conditions. This case study showcases how Xr traffic & safety visualization transformed urban mobility management by providing immersive, real-time, and data-driven traffic control environments for smart cities.
By implementing Xr traffic & safety visualization, municipal authorities, traffic departments, and urban planners gained a unified, interactive view of road networks, traffic flows, accident-prone zones, and public safety risks. This immersive system enabled faster decisions, better coordination between departments, and proactive traffic management. Designed for smart cities, transportation agencies, and public safety departments, the solution demonstrates how Xr traffic & safety visualization builds safer, smarter, and more efficient urban mobility ecosystems.
Project Requirement
The client required a centralized urban mobility platform to monitor traffic conditions, improve public safety, and optimize transportation planning. The main goal was to shift from reactive traffic control to predictive, intelligent mobility management.
Key requirements included:
- Real-time visualization of traffic flow and congestion zones
- Predictive traffic risk analysis using AI
- Immersive city-scale traffic monitoring environment
- Integration of AI powered traffic monitoring in XR
- Scenario simulations for accident prevention and emergency response
- Centralized control system using XR Traffic Visualization
- Data integration across transport, safety, and smart city systems
To meet these needs, the project was built around a scalable Xr traffic & safety visualization platform designed for long-term smart city growth.
Project Planning
Planning focused on aligning city infrastructure data with immersive visualization and real-world operations. Our team collaborated with urban planners, traffic engineers, and municipal officials to design a practical and usable system.
Key planning steps included:
- Mapping critical traffic corridors and high-risk zones
- Structuring AI models for predictive traffic analysis
- Designing immersive interfaces for city control rooms
- Planning integration of AI powered traffic monitoring in XR
- Creating multi-user XR environments for collaborative decision-making
- Structuring scalable architecture for future expansion
This ensured Xr traffic & safety visualization was not just visually powerful, but operationally effective for daily city management.
Project Process & Execution
Execution began with integrating real-time data from traffic sensors, cameras, GPS systems, GIS platforms, and urban databases. AI engines processed this data to generate predictive insights, which were then visualized through immersive XR environments.
The Xr traffic & safety visualization platform enabled city authorities to:
- Monitor real-time traffic flow and congestion
- Visualize accident-prone zones and safety risks
- Predict traffic disruptions using AI analytics
- Simulate emergency response scenarios
- Manage urban mobility through XR Traffic Visualization dashboards
- Coordinate departments using a unified XR environment
Through AI powered traffic monitoring in XR, city operators could anticipate congestion, manage peak traffic hours, and respond to incidents faster. Xr traffic & safety visualization replaced disconnected screens with a single immersive command center for traffic and safety operations.
Challenges & Learning
Data Integration Complexity:
Multiple data sources required standardized integration. Early data structuring improved system reliability.
Performance Optimization:
Real-time AI processing and immersive XR visualization needed performance balancing for smooth operation.
User Adoption:
Simple, intuitive interfaces were essential for rapid adoption by municipal teams.
Operational Alignment:
The platform had to fit real traffic control workflows, not just act as a visualization tool.
These learnings strengthened the scalability and usability of the XR traffic & safety visualization system.
Client Deliverables
- Full-scale Xr traffic & safety visualization platform
- AI-driven predictive traffic monitoring system
- Immersive XR traffic control environment
- XR Traffic Visualization dashboards
- AI powered traffic monitoring in XR modules
- Real-time urban mobility monitoring tools
- Multi-department collaboration platform
- Scalable smart city mobility framework
- Visualization systems for planning, safety, and governance
Conclusion
This case study proves that Xr traffic & safety visualization is not just a visualization solution—it is a strategic transformation tool for smart cities. By integrating AI powered traffic monitoring in XR and advanced XR Traffic Visualization, city authorities achieved safer roads, smarter traffic management, and better public safety outcomes. Municipal leaders, traffic engineers, and urban planners gained real-time clarity, predictive insights, and immersive control over complex urban mobility systems. With Xr traffic & safety visualization, cities move beyond reactive traffic control toward intelligent, connected, and future-ready urban mobility management.